Wednesday, September 26, 2012

Change a View to a ScrollView in Xcode Interface Builder

I recently needed to change UIView to a UIScrollView, then embed that ScrollView into a View. I won't go into the underlying code required to manipulate scrollViews. I am interested here in getting the UI correct with InterfaceBuilder.

First, with Xcode IB, open the storyboard and locate the View you want to change. With the Utilities View (the rightmost button of the View group on the Xcode Toolbar), show the Identity Inspector.

Change the Class under Custom Class from UIView to UIScrollView.


Since you need to embed the scrollView into a View, you can manually add a View under into the parent View Controller visual object or wait and use the Xcode Menu > Editor > Embed In > View command later. If you do it now, you will need to adjust the ScrollView position in the View window.

The "View" is now a scrollView but the Attribute Inspector still indicates it is a View.


We want the Attribute Inspector to look like this:


To get this, in Xcode, use right-click on the storyboard, and Open As > Source Code. 


Now, in the XML source, search for UIScrollView. You will find something like this: (the !-- and -- are XML comments that I added)


Change that to the following: (the !-- and -- are XML comments that I added)


Note that the id is the same.

Also, change the associated /view to /scrollView at the bottom of this XML clause.

That's it.

If you want to now , use the Embed In command to embed the ScrollView in a View.


Monday, February 27, 2012

Using a Custom Prototype tableViewCell with an IOS Storyboard

I was having all sorts of issues (disappearing data, incorrect data showing up in table view cells) attempting to use a custom, prototype cell from a Storyboard in a sub-classed UITableViewController that pulls from Core Data. Using a technique found at StackOverflow and the following works:

1) Create a subclass of UITableViewCell, call it MyCustomTVCell

2) Create the custom xib (MyCustomTVCellXibFile) file, pull in a tableViewCell. Make it custom, and make sure to use a unique Reuse Identifier (My Unique Reuse ID).

3) In the Identity Inspector, assign it the MyCustomTVCell class

4) Pull in a label on the tableViewCell.

5) Control-drag from the label to the MyCustomTVCell.h file
to IBOutlets. (call it label01)

6) Use the method registerNib:forCellReuseIdentifier: in tableView:cellForRowAtIndexPath: (thanks @richard-venable)


static NSString *CellIdentifier = @"My Unique Reuse ID";

[tableView registerNib:[UINib nibWithNibName:@"MyCustomTVCellXibFile" bundle:nil] forCellReuseIdentifier:CellIdentifier];


7) Create a cell with the MyCustomTVCell subclass:

MyCustomTVCell *cell = (MyCustomTVCell *) [tableView dequeueReusableCellWithIdentifier:CellIdentifier];
 

if (cell == nil) {
        cell = [[
MyCustomTVCell alloc] initWithStyle:UITableViewCellStyleDefault reuseIdentifier:CellIdentifier];
    }


8) Assign CD data to the now extended properties of the cell, i.e.

cell.label01.text = "fetched data from CoreData";

It works.

Sunday, October 02, 2011

I am interested in learning more and more about the evolving field of software development and engineering, especially Mobile Applications and Cloud Networking. So I am always on the lookout for upcoming meetups and events. Have you heard about Silicon Valley Code Camp. This is one that is all about engineer to engineer exchange, developers teaching developers, and it's an all volunteer setting. There is even an iPhone app for it.

I'll be there:

CodeCamp at FootHill College.

I am volunteering for a slot and also attending the following sessions:
  • iOS Application Architecture

  • TurboCharge your iPhone project with Three20 (an open-source Objective-C library)

  • iPhone Development Kickstart

  • Hands on BlackBerry Playbook, iOS and Android Development

  • What is Google App Engine?

  • Google App Engine workshop

  • Automated GUI Testing on Mac using ATOMac

    There is a lot to choose from. Hope to see you there!

Vince


Saturday, October 01, 2011

Xcode Profiling for Fun and Efficiency

If you are like me, you enjoy discovering new ways to gain insight into what is happening with your code. Especially, when it comes to performance and scalability. And making things as tight and as efficient as possible.

Writing and executing graphics programs for simulations and games can be quite taxing on CPU resources. I say that because I got real concerned with a recent program I wrote called Life which simulates digital cellular life forms that grow, prosper or perish in a colony of peers based on some simple growth rules (for more information, google: game of life wiki conway).  Here are sample graphics of a few time slices of an animated "snowflake". Other shapes and life forms are possible.


On my first iteration of the code, I wanted to understand why my program was taxing the CPU at what appeared to be a steady 15% utilization in the OSX Activity Monitor. I wanted more details on what was happening.


In the code, I also made the main simulation loop as tight as possible, eliminating any extraneous calls or assignments, and passing any large data structures to  functions by reference only.


With that accomplished, my investigations led to parts of the code that were  called most often. From there, I would be able to "see" which routines or calls were taking the most time to execute.


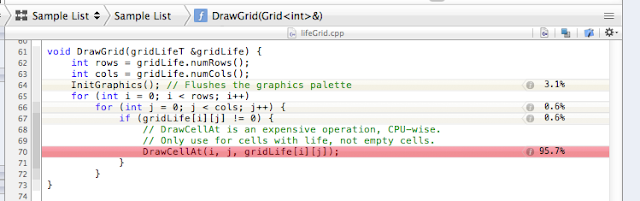
To cut to the chase, I intuited that the call that writes pixels to the graphics palette was exhibiting the most influence on the time profile. In fact, the code, prior to performance enhancement, looked like this:

Obviously, DrawCellAt() is called the most. This is a "free" library function (not a class) (I have access to the source for further inspection).


So what's happening? Prior to this, the grid is continually inspected and updated based on the Life growth rules. After that, the next generation of life is determined and stored in the gridLife variable, then DrawCellAt is called for every cell in the grid.... every cell in the grid.... ouch! Even for cells that are now empty due to a life form that recently died and even for cells that are basically serving background, DrawCellAt() is called. Hmmm... that's expensive, CPU-wise.

So again, what's happening? Well, Here's one way to answer this. I know that the graphics palette is 21 rows x 30 columns or 630 cells and the snowflake is on average 50 cells. Assuming on the next generation, it is also 50 cells, then on average, about ~10-20% of the cells will need updating, either alive or dead, to keep the animation moving. But if the code is blindly updating all 630 cells, whether it had or has life or not, there are slim chances to achieve any efficiency. What is needed is some way to "compress" the data that is written to the graphics palette.

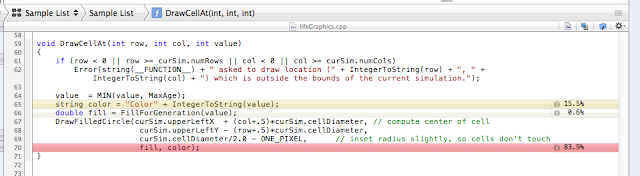
So I rewrote the routine to flush the graphics palette and tighten the loop to only call DrawCellAt() when there is "life" in the next-generation cell:


The result? A 5x to 7x improvement in CPU % utilization (down to ~3%). That's pretty good.


So what's really happening?

Enter Xcode Profiling!

Profiling is an Xcode compiler option can be invoked while developing, executing and testing code. In this case, I want to "see" the difference between versions 1 and 2 of DrawGrid in terms of CPU resource utilization within the code itself.

Here is the quick HOW-TO procedure:

If you want to follow along: you can get the source here and load into Xcode:

https://github.com/vincemansel/Life

(Or just git the repo and open the Instruments4.trace file. You will need to change Search Paths in Preferences to point to where the source files live.)
  •  In Xcode, select the Profile command (Hold the mouse down momentarily on the Run command and several options will appear. Select Profile.

  • This launches "Instruments" which provides profile options. Choose Time Profiler.
  • This starts "Life", the program to profile. Enter parameters into Life to execute the simulation. (I simulated the snowflake file on level 2, Plateau mode).
  • I am interested in writes to the graphics palette. Capture about 10 seconds of data and kill the process, or stop Recording data.
  • Do this for both versions of the program (i.e. one with DrawGrid1 and one with DrawGrid2)
  • Analyze the data as follows:
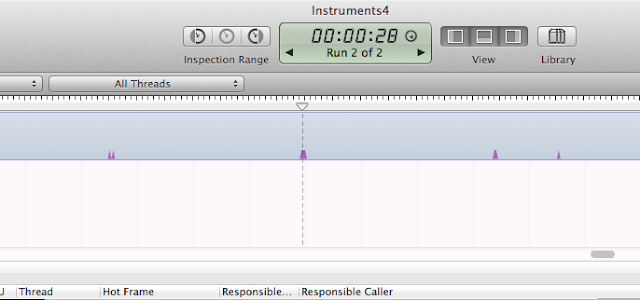
The Instrument will show a time graph of the program CPU usage by default. The time graph is 100ms/pixel.


I can also open up the Extended Detail panel on the right side of the window. This shows a stack trace for DrawGrid() and beyond.

Since Time Profiler is compressing the time line, expand it so it looks like this (~500us/pixel).


In the Sample List, select a sample to hightlight. Note it is highlighted where the "scrubber" or time-marker is currently placed. Use the up or down arrow to scroll through the timeline, jumping from sample to sample. Any sample will do that indicates the code is currently running in the Life process.


In the Extended Detail panel, I see the call list that I am interested in. So I first double-click RunLifeSim() to determine how much "time" the program is spending in DrawGrid().

This opens a window directly into the code:


I see that DrawGrid occupies over 99% of the resources in this function.

I can go further.... click back to the SampleList.... double-click on DrawGrid() in the Extended Detail panel.


Aha, 100%. This is making sense. But I want to go further.... open DrawCellAt()... open DrawFilledCircle()...

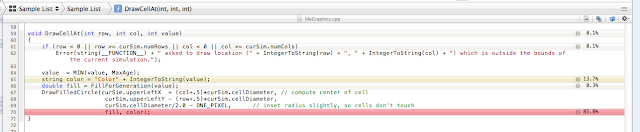
DrawCellAt() - Hmmm...


This gives me an indication of what is taking up time to do the work. It does not tell me how or what to fix but insight is gained into the inner workings of the code...

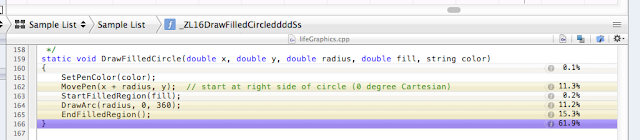
DrawFilledCircle() - Too deep, but interesting...

Now, what about DrawGrid2. Where is the improvement? I want to "see" it. Check it out:

Every update interval results in a smaller burst of CPU usage.

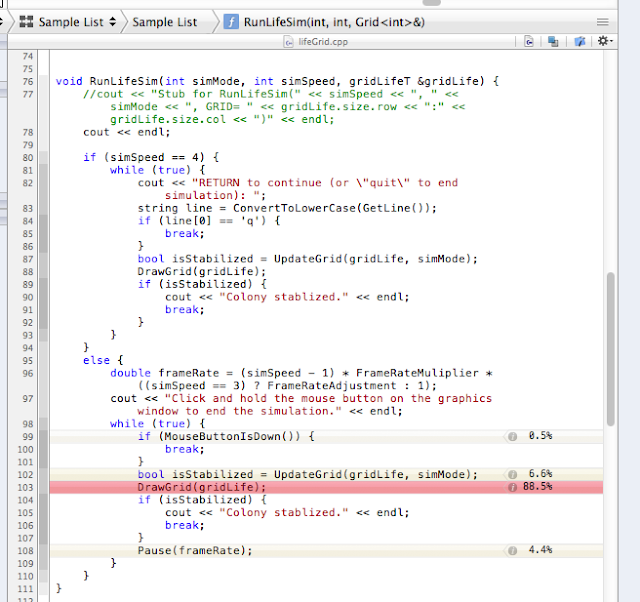
RunLifeSim() - I see improvement!!!

DrawGrid() - I see a little bit here too!

DrawCellAt2() - This works on a cell by cell basis. No improvement here.

Reducing the number of calls to DrawCellAt() (or compressing the amount of graphics data written) reduces the amount of resources that DrawGrid() is taking as a percentage of the overall program. 


Also note the reduction in time that the code is taking every update interval (0.5 seconds). I reduced the time scale down to 50 us/pixel, For DrawGrid1, the "time burst" is 14.160 msec.


For DrawGrid2, it is 0.954 msec!
A 14x improvement!!! 
Awesome!


Recap: 14x improvement in the code. 5x - 7x improvement at the process level. Done.

That was fun!

Code for Life and the Instruments trace file is available here:

https://github.com/vincemansel/Life

Life was developed and executed on a MacPro, 2 x 2.8 GHz Quad-Core Intel Xeon with 8GB 800MHz DDR2 F8-DIMM and OSX Version 10.7.1 with Xcode Version 4.1 Build 4B110.

Acknowledgements to the folks over at Stanford Computer Science (SEE) for the LIfeGraphics resources and the underlying utility programs. You can find them on ItunesU.

Send me a comment. Or follow my links to get in touch.

Thanks, Vince

Tuesday, September 27, 2011

Chaos Games and Fractals

I just attended the HTML5 Developer's Conference in San Francisco. I learned a handful of things about HTML5, JavaScript, Node.js and a checked out a few companies that are doing cool things to allow devs to create apps and port to various mobile platforms.

During lunch break, I continued working on Chaos game (see http://en.wikipedia.org/wiki/Chaos_game for more information). Basically, I finished the specification for 3 vertices and discovered, yes, it creates a cool fractalized, coherent graphics image:

The algorithm is basically this:
1) Ask the user to click three points in the window. These become the 3 vertices of  a triangle. Draw lines between the 3 points. Choose one vertex at random.
2) Draw a small circle at that point.
3) Choose another vertex and move the current point 1/2 the distance towards that vertex.
4) Repeat steps 2 and 3 until the user clicks the mouse again.

Walla! Nice result.
I decided to extend this a bit to add more vertices. The results were not so spectacular. Then, I decided to change the rendering algorithm every so slightly by changing the divisor to 3. Something interesting occured. A shadow image appears outside the original bounds of the figure drawn out by the user. A run with 6 vertices and a divider of 6 yeilds the following:

Try it out. The C++ source and Xcode project are parked at github. Also, you can just run the app on your Mac. It will prompt you for the number of vertices and dividers so you can experiment with shapes of your own. Fractal away! 


https://github.com/vincemansel/ChaosGame2 
 
Vince
 
p.s. Thanks to eroberts at Stanford for the utility libraries. 


Wednesday, May 20, 2009

Obtaining a CCNP in Four Months

OK... you first have to have some prior IP networking experience to be able to understand the language and the concepts. But, if you are focused and dedicated, you can obtain the CCNA in a month and the CCNP in four months, full-time and probably, one year part-time, through a course of self-study, reading and hands-on lab work. I just obtained the CCNP certification last week and the CCNA in January.

Basically, get copies of the Cisco Exam Certification Guides for the CCNA and CCNP. Check out the Cisco Learning Center, especially for Also, obtain a good Video course, like CBTNuggets or TrainSignal, to introduce the topics and get a broad level perspective.

To build your lab, you can find real equipment on ebay. But I would suggest purchasing a powerful PC and porting GNS3/Dynamips, a cisco router emulation environment (do a google search). This provides emulated testbed of routers for the Cisco 17xx, 26xx, 36xx and 72xx etc, with real IOS capabilities. There is also enough coverage for VLANs, Layer 3 switching and trunking with the NSM module on some of the routers. I was able to emulate up to 9 routers on Windows XP running over OS-X 10.5.x bootcamp on a 2.8 GHz Quad Core MacPro.

Here are some of the areas that I enjoyed studying and a have very strong knowledge.
Most of these of these topics are covered with hands-on labs.

• Routing: OSPF/EIGRP/BGP/IS-IS, MPLS, IP Multicast, PIM, IGMP, Frame Relay, NAT
• Layer 2/3 Switching: VLANs, 802.1Q, RSTP, HSRP, PPPoE, PPPoA
• Security and Services: IPSec, GRE, Radius/AAA, VPNs, SSH, 802.1X, VoIP, Wireless

QoS: Queuing, DSCP, Congestion Management/Avoidance, Traffic Shaping/Policing, NBAR

Wireless and VoIP require additional hardware, and you will also need to obtain a copy
a copy of the Cisco SDM for some labs.

Plan on 6-8 hours per day, 5 to 6 days per week.
I took the two test route for the CCNA. The CCNP consists of four exams, about 1 per month.
Add a week additional time in case you fail and exam and need to re-take (like I did on the BSCI). I needed to pace myself with the BSCI lab work because of the amount of fun I had doing the configurations and debug. The BSCI was the hardest and most people, I hear, opt to take
it last. I took it first and it provided a solid foundation for all the other exams. Here is a BGP lab layout from a configuration lab.


Go for it! You can do it!

Thursday, February 12, 2009

Filter a RIP route with Distribute List

This one seems worthy of a blog post. Previously, I discovered some esoterically cool stuff about auto-summarization and how in RIPv2, it is possible to create routing "blackholes" when certain routes are auto-summarized across classful boundaries then fed back to the originator of the route. The originator of the route then point back to the routers that auto-summarized the route. The network is a circular so eventually split-horizon stops the route update madness. Bottom line, pings to anything unknown address in the 10.0.0.0/8 network will loop between two routers until the TTL expires. This came about in my final lab ICND2 lab studies. Check out the ICND2 Certification Guide, Appendix F, last question and check the output of the show ip route command. Turns out, EIGRP stops this kind of thing cold with the clever Null0 bit bucket.

But on to the subject of the day.

I discovered how to use a distribute-list to filter a RIPv2 update. The whole exercise was a prelude to how to summarize (there's that word again) external RIP routes into a OSPF network across an Autonomous System Boundary Router (ASBR). The problem became how to start with a clean network where none of the OSPF networks were leaking into the RIP domain and none of the RIP routes were spilling into the OSPF domain. I use those words because I lack the technical-speak for the situation. Suffice it to say, my studies and meanderings have paid off with a nice solution.


Check out the diagram. The ASBR, R4, is running RIPv2 and OSPF. Each serial interface is in the 10.0.0.0/8 network. Since the network command in RIP only accepts classful networks, both S1/0 and S1/1 are included in the RIP process. So a passive-interface Serial 1/1 prevents the RIP advertisement leakage into the OSPF side of the R4.

Looking at the route table on R5, the 10.1.34.0/30 network is advertised since it is a connected interface on R4. That is really not desired because it exposes a part of the OSPF backbone network to the external network. Plus a ping from R5 to R3's S1/0 interface would go unanswered anyway. Investigating the distribute-list command allows for filtering routes based on an access-list. Creating an access-list that denies the subnet address (source address) and attaching itto the outgoing side of R4's Serial 1/0 interface filters the route. In fact, running debug ip rip displays "suppressing null update" for the update going out Serial 1/0. The configuration is listed in the diagram.

Using a passive-interface command on Serial1/0 would also work to suppress the RIP update, but it would defeat redistributing any learned routes to the external RIP domain from R4. That does not seem desirable since the next step in this investigation will be how to get networks in Area 1 (192.168.x.x/16) to talk to networks in the RIP domain (172.16.x.x/16) without using a static route and not exposing any details about Area 0 to RIP. Neat trick... later.